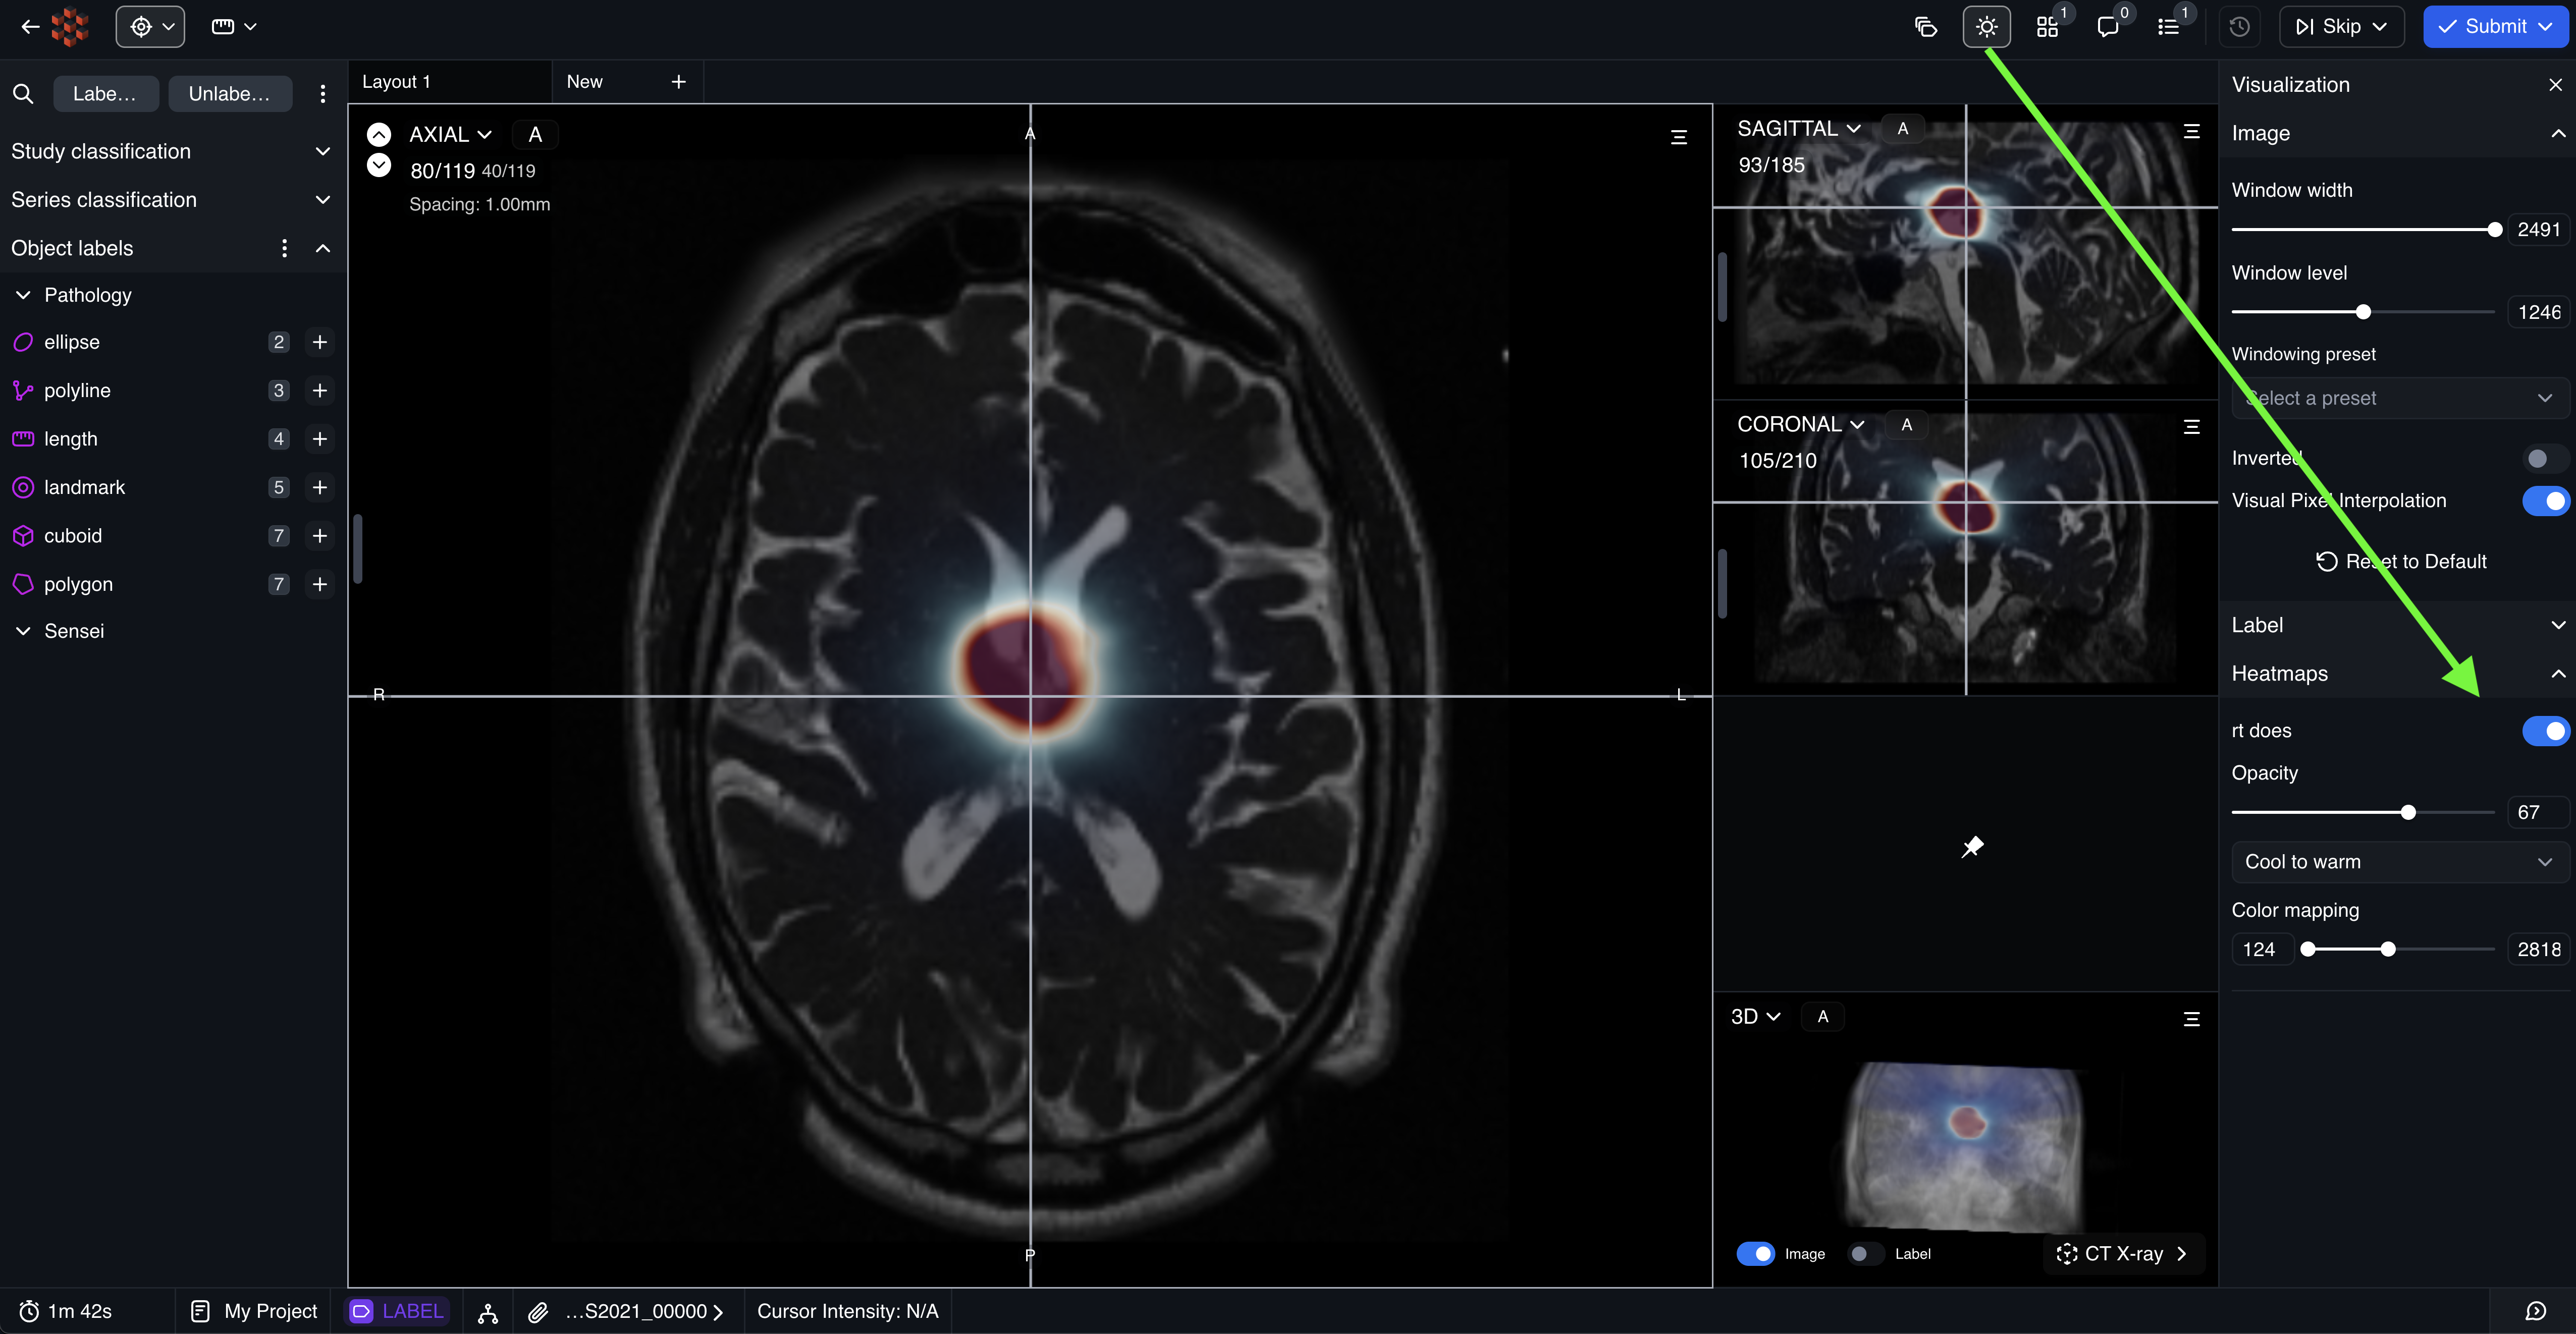
type Series {
  ...
  heatMaps: [HeatMap]
}

type Series {
  ...
  heatMaps: [HeatMap]
}

type HeatMap {
  name: string;
  item: string; // File path
  // Visualization preset.
  //Available Options: ['Cool to warm' (DEFAULT), 'Warm to cool',
  //                   'Rainbow desaturated', 'Cold and hot', 'X-Ray',
  //                   'Red', 'Blue', 'Green', 'Yellow', 'Magenta']
  preset?: string;
  // Scalar data range. If not provided, it's calculated from the data.
  dataRange?: [number, number];
  // Opacity mapping: [scalar1, opacity1, scalar2, opacity2, ...]
  // E.g., [0, 0, 0.5, 0.5, 1, 1] means scalar 0 has opacity 0, scalar 0.5 has opacity 0.5, scalar 1 has opacity 1.
  opacityPoints?: number[];
  // Color mapping: [scalar1, r1, g1, b1, scalar2, r2, g2, b2, ...]
  // E.g., [0, 0, 0, 1, 0.5, 0, 1, 0, 1, 1, 0, 0] means scalar 0 is blue, scalar 0.5 is green, scalar 1 is red.
  rgbPoints?: number[];
  // Opacity mapping for 3D viewport. If not provided, opacityPoints are used.
  opacityPoints3d?: number[];
}