

When to Run a Performance Test
- Experiencing Slowdowns: If viewing, slicing, or 3D volume rendering feels sluggish or drops frames.
- Troubleshooting Issues: When working with the RedBrick AI support team to identify client-side bottlenecks (e.g., hardware acceleration or network latency).
- Evaluating Workstations: Benchmarking annotator or radiologist hardware before onboarding them onto large annotation projects.
- Hardware/Browser Comparison: Comparing performance across different browsers (e.g., Chrome vs. Edge) or hardware setups.
How to Access and Run the Test
1
Open the Help Menu
In the bottom-right corner of the RedBrick AI web app, click the Help (
?) icon to open the help menu.2
Select Performance Test
Click Performance Test from the menu options.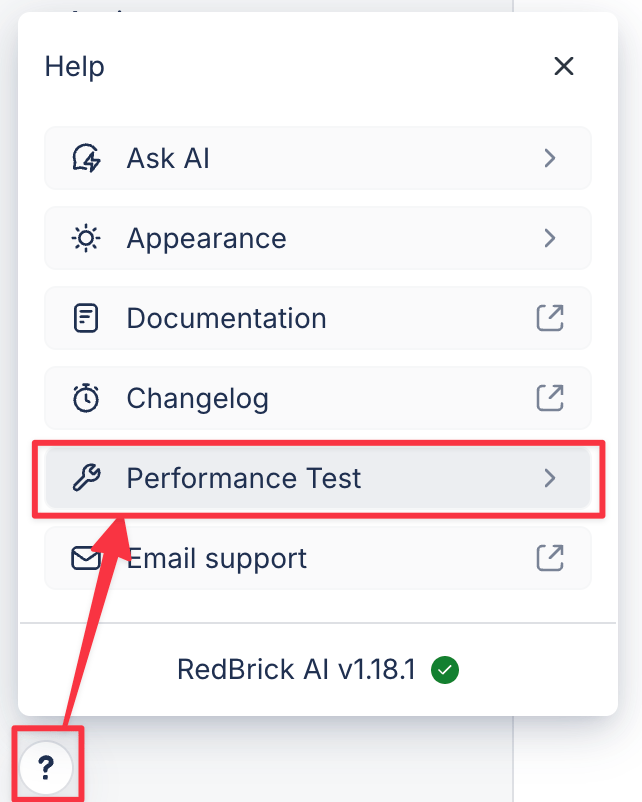
You can also open diagnostics directly in your browser by navigating to
/<your-org-id>/performance-test (e.g., https://app.redbrickai.com/my-org/performance-test).3
Start Diagnostics
Click Start Diagnostics in the top toolbar of the modal. The suite runs through 5 test
categories sequentially while displaying real-time progress.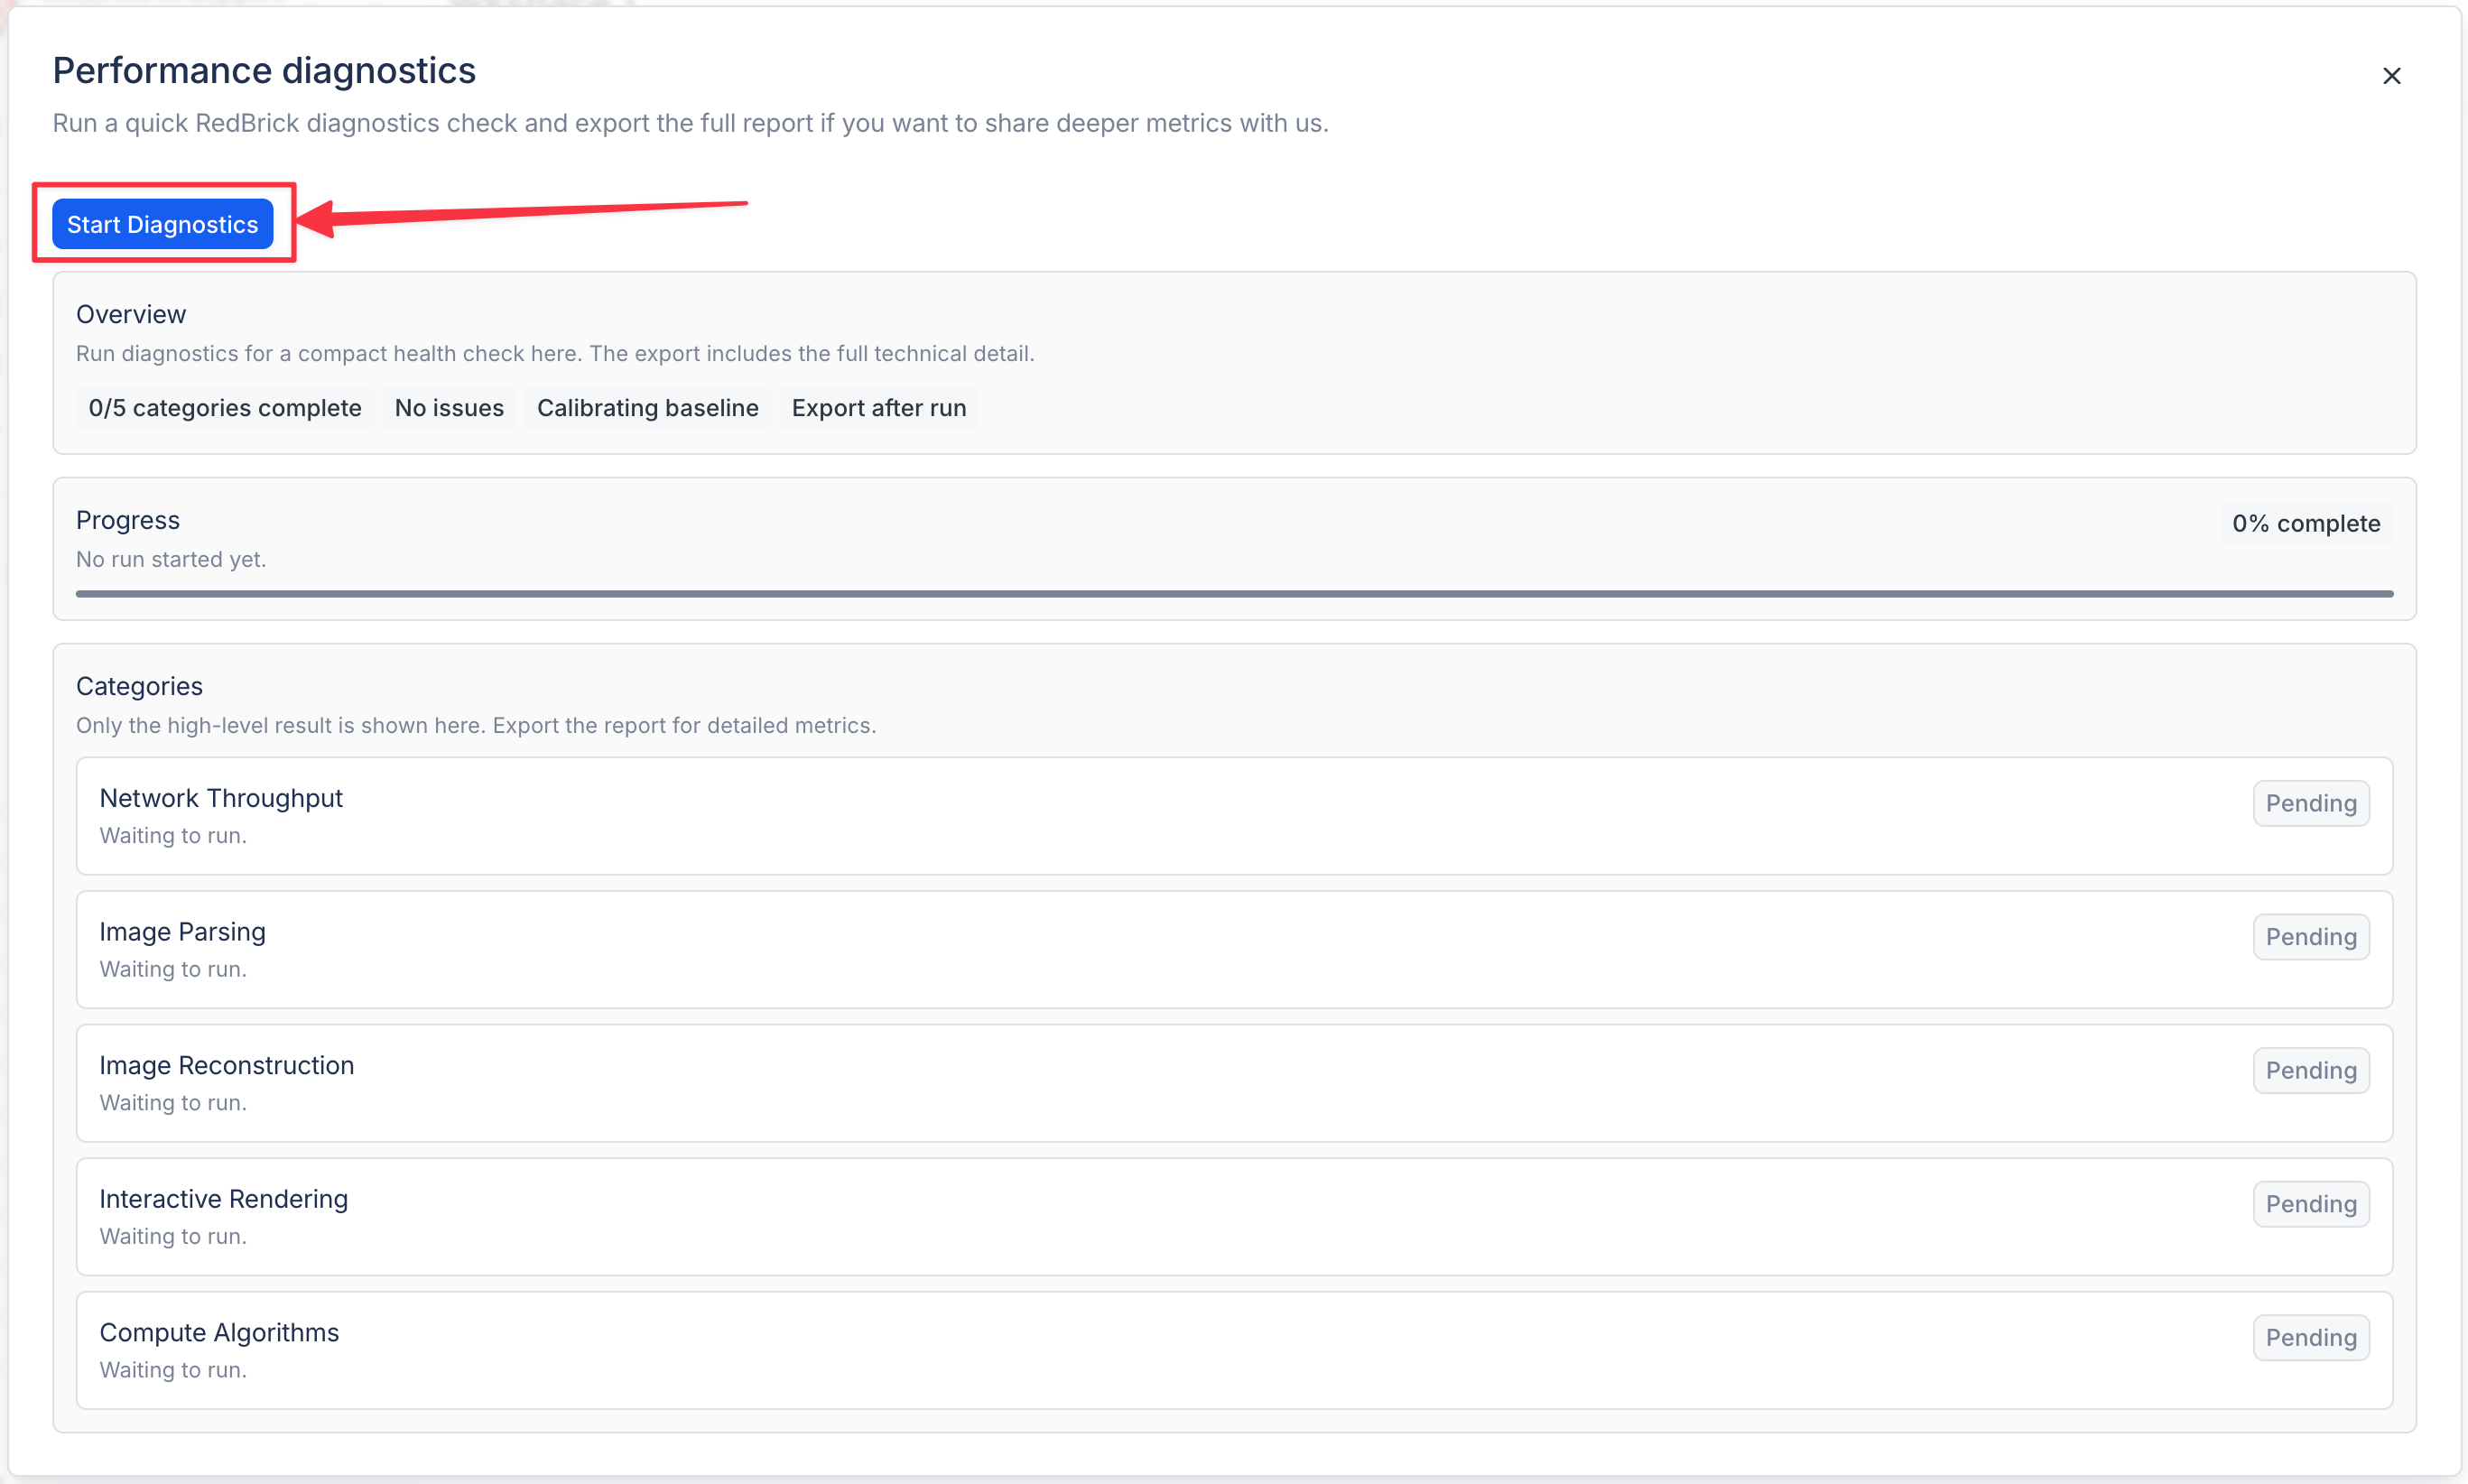
4
Review the Results
Once all tests complete, you will see an overall Local Score (0–100%), category breakdown, execution duration, and pass/fail indicators.
Test Categories
The performance suite executes realistic imaging tasks divided into five core categories:1. Network Throughput
1. Network Throughput
Measures download speed, transfer rates, and browser caching efficiency when fetching medical image files:
- Single File Download: Tests latency and retrieval speed for an individual DICOM object.
- Concurrent Downloads: Measures parallel download throughput when fetching multiple files simultaneously.
- Large File Download: Benchmarks cold download performance for large volumetric files (such as NIfTI volumes).
- Cached Download: Verifies warm-cache retrieval speeds from local storage.
2. Image Parsing
2. Image Parsing
Evaluates how quickly your browser decodes DICOM datasets: - Single Image Decompression:
Measures single-threaded JPEG 2000 decompression latency. - Parallel Decompression: Measures
throughput when decompressing multiple image frames concurrently across Web Workers. - Header
Parsing Batch: Measures raw DICOM metadata parsing performance independent of image
decompression.
3. Image Reconstruction
3. Image Reconstruction
Measures the speed of building viewable 2D slices and 3D volumes in memory: - 2D Single Slice
Reconstruction: Time required to build an individual diagnostic slice from a DICOM series. -
2D Batch Reconstruction: Sustained multi-slice reconstruction throughput. - 3D DICOM Volume
Reconstruction: Construction speed for full volumetric arrays used in MPR and 3D views.
4. Interactive Rendering
4. Interactive Rendering
Measures graphical rendering performance and framerate stability in frames per second (FPS): -
2D Slice Rendering: Steady-state framerate when viewing diagnostic 2D slices (Target: ~60
FPS). - 3D Volume Rendering: Framerate under volumetric 3D view rendering (Target: ~45 FPS). -
Interactive Rendering: Framerate under continuous viewport manipulation, camera panning, and
3D rotation (Target: ~40 FPS).
5. Compute Algorithms
5. Compute Algorithms
Benchmarks WebAssembly and CPU-intensive computation used in semi-automated segmentation workflows:
- Connected Threshold 2D: Region-growing threshold calculations on a 2D slice.
- Fill Holes (2D & 3D): Morphological hole-filling operations on binary segmentation masks.
- Level Set (2D & 3D): Active contour and level-set segmentation refinements.
- Mask Dilate 3D: 3D morphological dilation passes commonly applied during volume brush edits.
Baselines & Scoring
- Overall Local Score: A weighted composite score (0–100%) synthesized across all five categories. Rendering, reconstruction, and compute algorithms carry higher weighting due to their direct impact on viewer interactivity.
- Default Benchmarks: By default, each test is measured against pre-defined performance benchmarks (e.g. 60 FPS for 2D rendering, sub-second execution for parsing and reconstruction tasks).
- Set Current Run as 100%: Saves the current machine’s benchmark to your browser’s local storage. This calibrates future runs against your specific hardware environment, making it easy to identify performance regressions or improvements over time.
- Clear Baseline: Resets your local calibration and restores the default global benchmarks.